How Does AI Mastering Software Analyze Frequency Balance in a Mix?
How AI mastering frequency balance analysis works: FFT spectrum, smoothing, genre target curves, LUFS, crest factor, stereo checks and the EQ it picks.
AI mastering frequency balance analysis starts with a spectrum: the software measures your mix with an FFT, averages and smooths it into bands, then compares it with a target curve for your genre or a reference track. The gaps become EQ moves, usually scaled back, alongside checks on loudness, crest factor and stereo width.
This guide covers the measurement side, from the spectrum to the EQ moves, what goes wrong and how to judge the result. We read every source below on 19 November 2026. For how the whole process compares with a human engineer, see how AI mastering compares to manual engineering.
How do AI mastering tools analyze frequency balance in a mixed track?
- Listen to a section. Tools differ in how much they hear. iZotope's Ozone 12 Master Assistant needs at least 8 seconds of playback, can analyze up to 60 seconds and recommends the loudest, fullest section, such as a final chorus. Logic Pro's Mastering Assistant analyzes the project, or only the cycle range if you set one. A quiet verse and a dense chorus give different answers.
- Turn audio into a spectrum. A fast Fourier transform (FFT) splits short windows of audio into frequency bins. Window size is a trade-off: Ozone's spectrum options note that larger windows give finer frequency resolution at the cost of time resolution. In their 2013 study of chart singles, Pedro Duarte Pestana and colleagues used 4,096-sample windows at 44.1 kHz, about 10 Hz per bin.
- Average over time. One frame jumps with every kick and vowel. Ozone's Average Time runs from Real Time to Infinite, and iZotope says longer averages show the overall tonal balance.
- Smooth into bands. Single bins are too detailed to act on, so analyzers group them into octave or third-octave bands, or critical bands that follow how we hear. Ozone offers Linear, 1/3 Octave, Critical and Full Octave views, and by default tilts its display 3 dB per octave around 1 kHz so pink noise looks flat.
- Remove level differences. A louder mix would look bigger everywhere, so spectra are normalized before comparison. Pestana's team scaled each song so its bins summed to one, which stops a single loud peak from distorting the comparison.
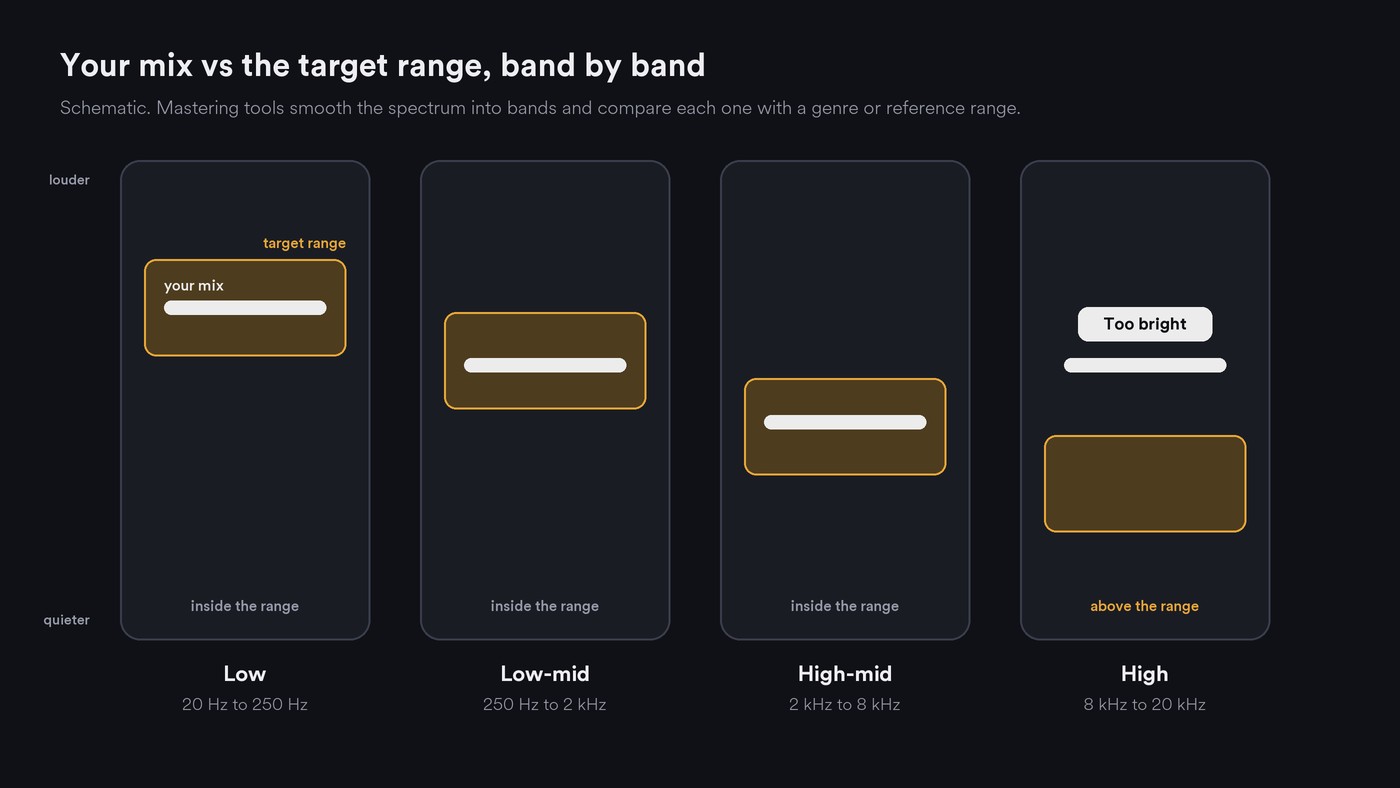
- Compare with a target. The smoothed, normalized curve is checked against a target range, band by band.
Where target curves come from
Most targets are averages of released music. Pestana, Zheng Ma, Joshua D. Reiss, Álvaro Barbosa and Dawn A. A. Black analyzed about half the singles that reached number one in the US or UK over 60 years, in a paper for the AES 135th Convention (October 2013). Their abstract reads: "With it, we found out that there is a consistent leaning towards a target equalization curve that stems from practices in the music industry, but also to some extent mimics natural, acoustic spectra of ensembles."
They describe that curve as falling roughly 5 dB per octave between 100 Hz and 4 kHz, steeper above, with a severe low cut around 60 Hz. Genres differed: they found top-end differences of more than 10 dB, with hip-hop and electronic music brightest and folk and jazz darker.
Commercial tools turn this into target ranges:
- iZotope Tonal Balance Control 2. Its help pages say factory targets represent typical spectral shapes in different styles. Your track is drawn in white against the typical range of variation in blue, across four bands: Low 20 Hz to 250 Hz, Low-mid 250 Hz to 2 kHz, High-mid 2 kHz to 8 kHz and High 8 kHz to 20 kHz. You can build a custom target from one file or a folder of them.
- Ozone 12 Master Assistant. Ten genre targets come from chart-topping hits, plus a Cinematic target from box-office film scores. A reference file becomes a target built from its loudest eight seconds.
The key idea is a range, not a line: a good analyzer flags a band only when it sits outside the spread of released songs in that style.
What else gets measured: loudness, crest factor and width
Frequency balance is never judged alone, because loudness and dynamics change how a spectrum reads.
- Loudness. Most tools measure it to ITU-R BS.1770, now at version 5 (November 2023). It applies K-weighting (a shelving filter for the acoustic effect of the head, then a high-pass filter), averages power over 400 ms blocks that overlap by 75%, and gates at −70 LKFS and then 10 dB below the result. True peak uses 4× oversampling at 48 kHz. Because the weighting reduces the lowest frequencies, a bass-heavy mix and a bright mix at the same LUFS can look very different on an analyzer.
- Crest factor. Tonal Balance Control shows the ratio of peak to RMS level in the low end. If it leans left, your low end may be too dynamic; if it leans right, too compressed. Ozone measures dynamics as the ratio of very short-term to short-term loudness.
- Stereo width and the low end. Ozone measures width as the ratio of mid to side power in four bands, and won't widen the bass if the low band is already narrow. Apple's Mastering Assistant parameters say correlation should stay above 0 for mono compatibility, and its Width knob turned fully left gives you a mono check.
How the EQ moves are chosen
- A static correction curve. The gap between your averaged spectrum and the target becomes an EQ curve, scaled by an amount control. Logic's Auto EQ slider sets how much of the estimated correction you hear, and its Custom EQ adds three broad points, each ±6 dB: a low shelf from 20 Hz to 200 Hz, a mid band from 200 Hz to 8 kHz and a high shelf from 8 kHz to 20 kHz. Ozone's Equalizer control scales every EQ node from 0% to 200%.
- Matching EQ. You capture a reference spectrum and your own, and the tool draws the difference. Ozone's Match EQ guide warns that a 100% match with 0% smoothing chases detail: "Those settings will try to capture every peak, valley, and level, which can result in extreme, unnatural EQs." iZotope suggests keeping the amount under 50% and raising smoothing.
- Dynamic and adaptive EQ. Some problems come and go. Ozone's Stabilizer is an adaptive EQ that reacts to the incoming audio and corrects toward the target, either with boosts and cuts or with cuts only; at full amount it can boost up to 9 dB, and at full smoothing its correction looks like three or four filters.
What can go wrong
- Reference mismatch. Match a sparse acoustic song to a dense EDM target and the tool adds low end and air the song never had. With Ozone, remember the reference target comes from its loudest eight seconds, which may be a drop.
- Over-brightening. If the target comes from loud, bright genres, a darker mix gets lifted on top, and an exciter can push sibilance and cymbals over the edge.
- An unrepresentative section. Analysing the intro or a breakdown gives the wrong average for the whole song.
- Masking that EQ can't fix. A master EQ moves everything in a range. If a guitar buries the vocal around the same frequencies, cutting there dulls both, so fix it in the mix.
Our list of common pitfalls of automated mastering plugins covers loudness and export traps.
A checklist to judge AI mastering frequency balance by ear and meter
- Level-match first. Use the tool's gain match or loudness compensation, or turn the master down until both read the same LUFS.
- Read the EQ curve. Big boosts or cuts mean the mix needs work in that range.
- Compare with a reference at matched loudness, on the chorus and the quietest verse.
- Check band by band. Is the low end controlled, the vocal present and the top end smooth rather than hissy?
- Check mono. Correlation should stay above 0, and the vocal shouldn't drop back when summed.
- Measure the exported file. Integrated loudness over the whole song and true peak on a BS.1770 meter.
- Listen on three systems: headphones, a phone speaker and a car or small speaker.
- Re-analyze after any mix change.
Where Soundverse fits
Soundverse is an AI music platform that takes you from idea to audience. Mastering One sits on the master bus of every AI Studio project. Its ✦ Master button listens to two seconds of the mix and estimates loudness, peak-to-loudness ratio and the balance of lows and highs, then sets Loudness toward your target, Tone toward your genre's balance and Dynamics from how peaky the mix is. Low, Mid and High bars show the master against markers for the chosen genre, the EQ shelves sit at 120 Hz and 8 kHz, and the Imager keeps the side signal out of the lows below 120 Hz. Play the chorus before you press it.
The page says its window meters are estimates, so add Analysis One after it for an FFT spectrum, gated K-weighted LUFS, 4× oversampled true peak, correlation and width per band. If the analysis points to a mix problem, Mix One works on the tracks themselves. All three run in your browser on every plan, including Free.
In this video, Mix One places a project's stems by genre, then Mastering One goes on the master chain with a chosen target, and the raw, mixed and mastered versions are compared.
FAQ
What is a tonal balance target curve? It's the typical spectrum of released music in a style, usually shown as a range per band. AI mastering tools compare your averaged spectrum with it and suggest EQ to close the gap.
Why does my AI master sound too bright? Usually the target or reference is brighter than your song, or the analysis heard a quiet section. Try a closer genre, analyze the densest chorus and lower the EQ amount.
Can AI mastering fix a muddy mix? Only partly. It can dip the low mids across the whole mix, but it can't separate two instruments fighting in the same range. Fix that in the mix, then master again.
How much of the song should the AI analyze? As much as the tool allows, and the most representative part. Ozone 12 asks for at least 8 seconds and up to 60, Logic can analyze the whole project, and Mastering One measures two seconds of whatever is playing.
Sign up for Soundverse free and try Mastering One on your next mix. More mixing and mastering guides on the Soundverse blog.